The Richardson–Ellingham Diagram
The Richardson–Ellingham diagram is the standard reference for high-temperature metallurgy, often serving as a map for chemical process engineers. But there is a difference between reading a map and understanding the geology that formed the terrain. This page provides a fully interactive and configurable Richardson–Ellingham diagram, allowing you to export it in various formats in exactly the shape and configuration you want. You can hide reactions, change the limits of the axes and even hide axes you don't need.
Below the tool, there is an articlethat tries to reconstruct the diagram from first principles. It refreshes the fundamentals of the physical-chemical basis of reaction dynamics, explores the competition between Enthalpy (stability) and Entropy (possibility) and finally combines it to form Gibbs Free Energy. I would appreciate any feedback via mail (manuel.leuchtenmueller@unileoben.ac.at) or LinkedIn.
To a chemical process engineer, the Richardson-Ellingham (or Jeffes) diagram is as vital as a topographic map is to a hiker. It is the standard reference for high-temperature metallurgy. But there is a difference between reading a map and understanding the geology that formed the terrain. While most students can trace the lines to find a reduction temperature, far fewer understand the elegant physical-chemical engine that drives those lines.
The objective of this article is not to teach how to read the chart, but to reconstruct it from first principles. We will refresh the physical-chemical basis of reaction dynamics, exploring the competition between Enthalpy (stability) and Entropy (possibility). We will see how they combine to form Gibbs Free Energy. Finally, we will derive the diagram from first principles, tracing the path from the fundamental laws of physics to the heart of a blast furnace.
From Enthalpy to Ellingham
Why Does Anything Happen?
The fundamental question of physical chemistry is, "Why does anything happen?" Why does iron rust? Why does ice melt? Why does wood burn? When we ask "if a reaction runs", we are asking about its spontaneity. Before we begin, we must be clear about one thing: "spontaneous" does not mean "fast". Spontaneity is a question of direction and possibility, not speed. Speed belongs to the field of kinetics (which we do not cover here). Spontaneity is all about thermodynamics, direction and equilibrium. This is what we will explore here.
Let's start with a classic example, the conversion of diamond to graphite: C(s, diamond) → C(s, graphite). Under normal conditions, this reaction is spontaneous. At standard temperature and pressure, graphite is a more stable form of carbon. A diamond will turn into graphite. However, this reaction is so slow that the transformation is not detectable on a human timescale. But thermodynamics tells us that this reaction happens. But not how fast it happens. Kinetics tells us why (thankfully for jewelers) it doesn't happen quickly. Our task is to derive the laws of spontaneity from the ground up. We will find that the answer is rarely simple. In fact it is the result of a relentless push and pull between two great, and often opposing, fundamental drives. Entalphy and Entropy.
Enthalpy: The Push for Stability
The first drive is the one we are all familiar with: the drive toward stability. Things "like" to be in a lower-energy state. A ball rolls downhill. A stretched spring "wants" to relax. In chemistry, energy is stored in the chemical bonds between atoms. It is helpful to think of these bonds as springs. To break a bond, you must put energy in to pull the atoms apart, just like stretching a spring. This is an endothermic process. To form a bond, the atoms "snap" together, releasing energy as they settle into a stable, low-energy state. This is an exothermic process. A chemical reaction is just an accounting for the energy balance of breaking old bonds and forming new ones. The change in enthalpy (denoted ) accounts exactly for this net balance of this energy transaction. If is negative (an exothermic reaction), it means the new bonds in the products are stronger and more stable than the old bonds in the reactants. The system has releases the energy difference then to the surroundings, usually in form of heat. If is positive (an endothermic reaction), it means we had to put in energy to build the products. Or in other words, the products are less stable than the reactants. This is the first fundamental drive: All things being equal, systems are pushed toward the state with the lowest possible enthalpy (a negative ). This is the push for stability. But it is only half the story.
The Tax for Existing
You have likely heard that is "the heat of reaction." This is true, but it is only true under a specific condition, namely under constant pressure and volume. To understand this, we must look at what enthalpy () is. Enthalpy is not a fundamental quantity. It is a so called "state function" that we invented to make our lives easier. Its definition is , where:
is the Internal Energy of the system. This is the "common sense" energy: the sum of all the kinetic energies (molecules whizzing around) and potential energies (the energy stored in those bond-springs) of all the particles in the system.
is the Cost of Occupying Space. This is the profound part. To create a system (say, a beaker of chemicals), you have to physically shove the entire atmosphere out of the way to make a space of volume . You must do this against the constant pressure of the world. This "room-making" costs energy.
The real value of this definition does not lie in the value of itself, but in what happens when we look at the change in (which is ) during a normal lab experiment:
A "normal lab experiment" happens in an open beaker, which means it happens at constant pressure (the pressure of the atmosphere around it).
If we look at a change in enthalpy () at constant pressure (), the definition becomes: which simplifies to (since doesn't change).
Now, let's look at the First Law of Thermodynamics. It states that the change in a system's internal energy () is equal to the heat added to the system () plus the work done on the system (): .
What is the "work" being done in our open beaker? As the reaction runs, it might produce a gas, expanding its volume ( is positive). To do this, it must push the atmosphere back. This is work done by the system, so the work done on the system is the negative of that: .
Let's substitute (4) into (3). The First Law for our beaker is: . (We use the subscript to specify "heat at constant pressure").
This equation is messy. It tells us that the simple heat we measure with a thermometer () is not equal to the true change in the system's internal bond energy (), because some of that energy was "wasted" in the work of pushing the atmosphere around (the term).
But... let's just rearrange equation (5): .
Now, look at equation (2) and equation (7). They are identical.
This is the "Aha" moment. By defining enthalpy as , we have created a quantity whose change () is exactly equal to the simple flow of heat () that we can measure in our constant-pressure world. Enthalpy is a brilliant accounting "shortcut". It cleverly bundles the messy "work-to-make-room" energy () into its own definition, so all we have to do is measure the heat to find the change in this new, very useful quantity. When we say a reaction is "enthalpy-driven," we mean it is driven by the push for stability, releasing a large amount of heat ( is very negative).
Entropy: The Pull of Possibilities
The first drive, enthalpy, is intuitive. The second drive, entropy (), is often harder to imagine and understand. Your textbook probably said something like "Entropy is a measure of disorder". This is, at best, a sloppy and misleading analogy. Does ice (an "ordered" crystal) melting into a puddle ("disordered" liquid) involve an increase in entropy? Yes. So far, so good. But what about a long, stringy, "disordered" protein molecule in water that spontaneously folds into a precise, intricate, "ordered" shape? That process also involves an increase in the universe's entropy. The "disorder" analogy completely fails. The real idea is much simpler, more beautiful, and far more powerful: Probability.
The Real Definition: Entropy as Possibilities
Let's build this from the ground up with a simple analogy: flipping coins.
Imagine a "Macrostate": This is the overall outcome you observe. For example: "I flipped 4 coins, and I got 2 Heads."
Imagine a "Microstate": This is the exact, specific arrangement that produced that outcome. For "2 Heads," the microstates are: HHTT, HTHT, HTTH, THHT, THTH, TTHH.
Now, let's count the possibilities (the number of microstates, , see also Figure 1 below):
Macrostate: "4 Heads". Microstates: HHHH. .
Macrostate: "3 Heads". Microstates: THHH, HTHH, HHTH, HHHT. .
Macrostate: "2 Heads". Microstates: HHTT, HTHT, HTTH, THHT, THTH, TTHH. .
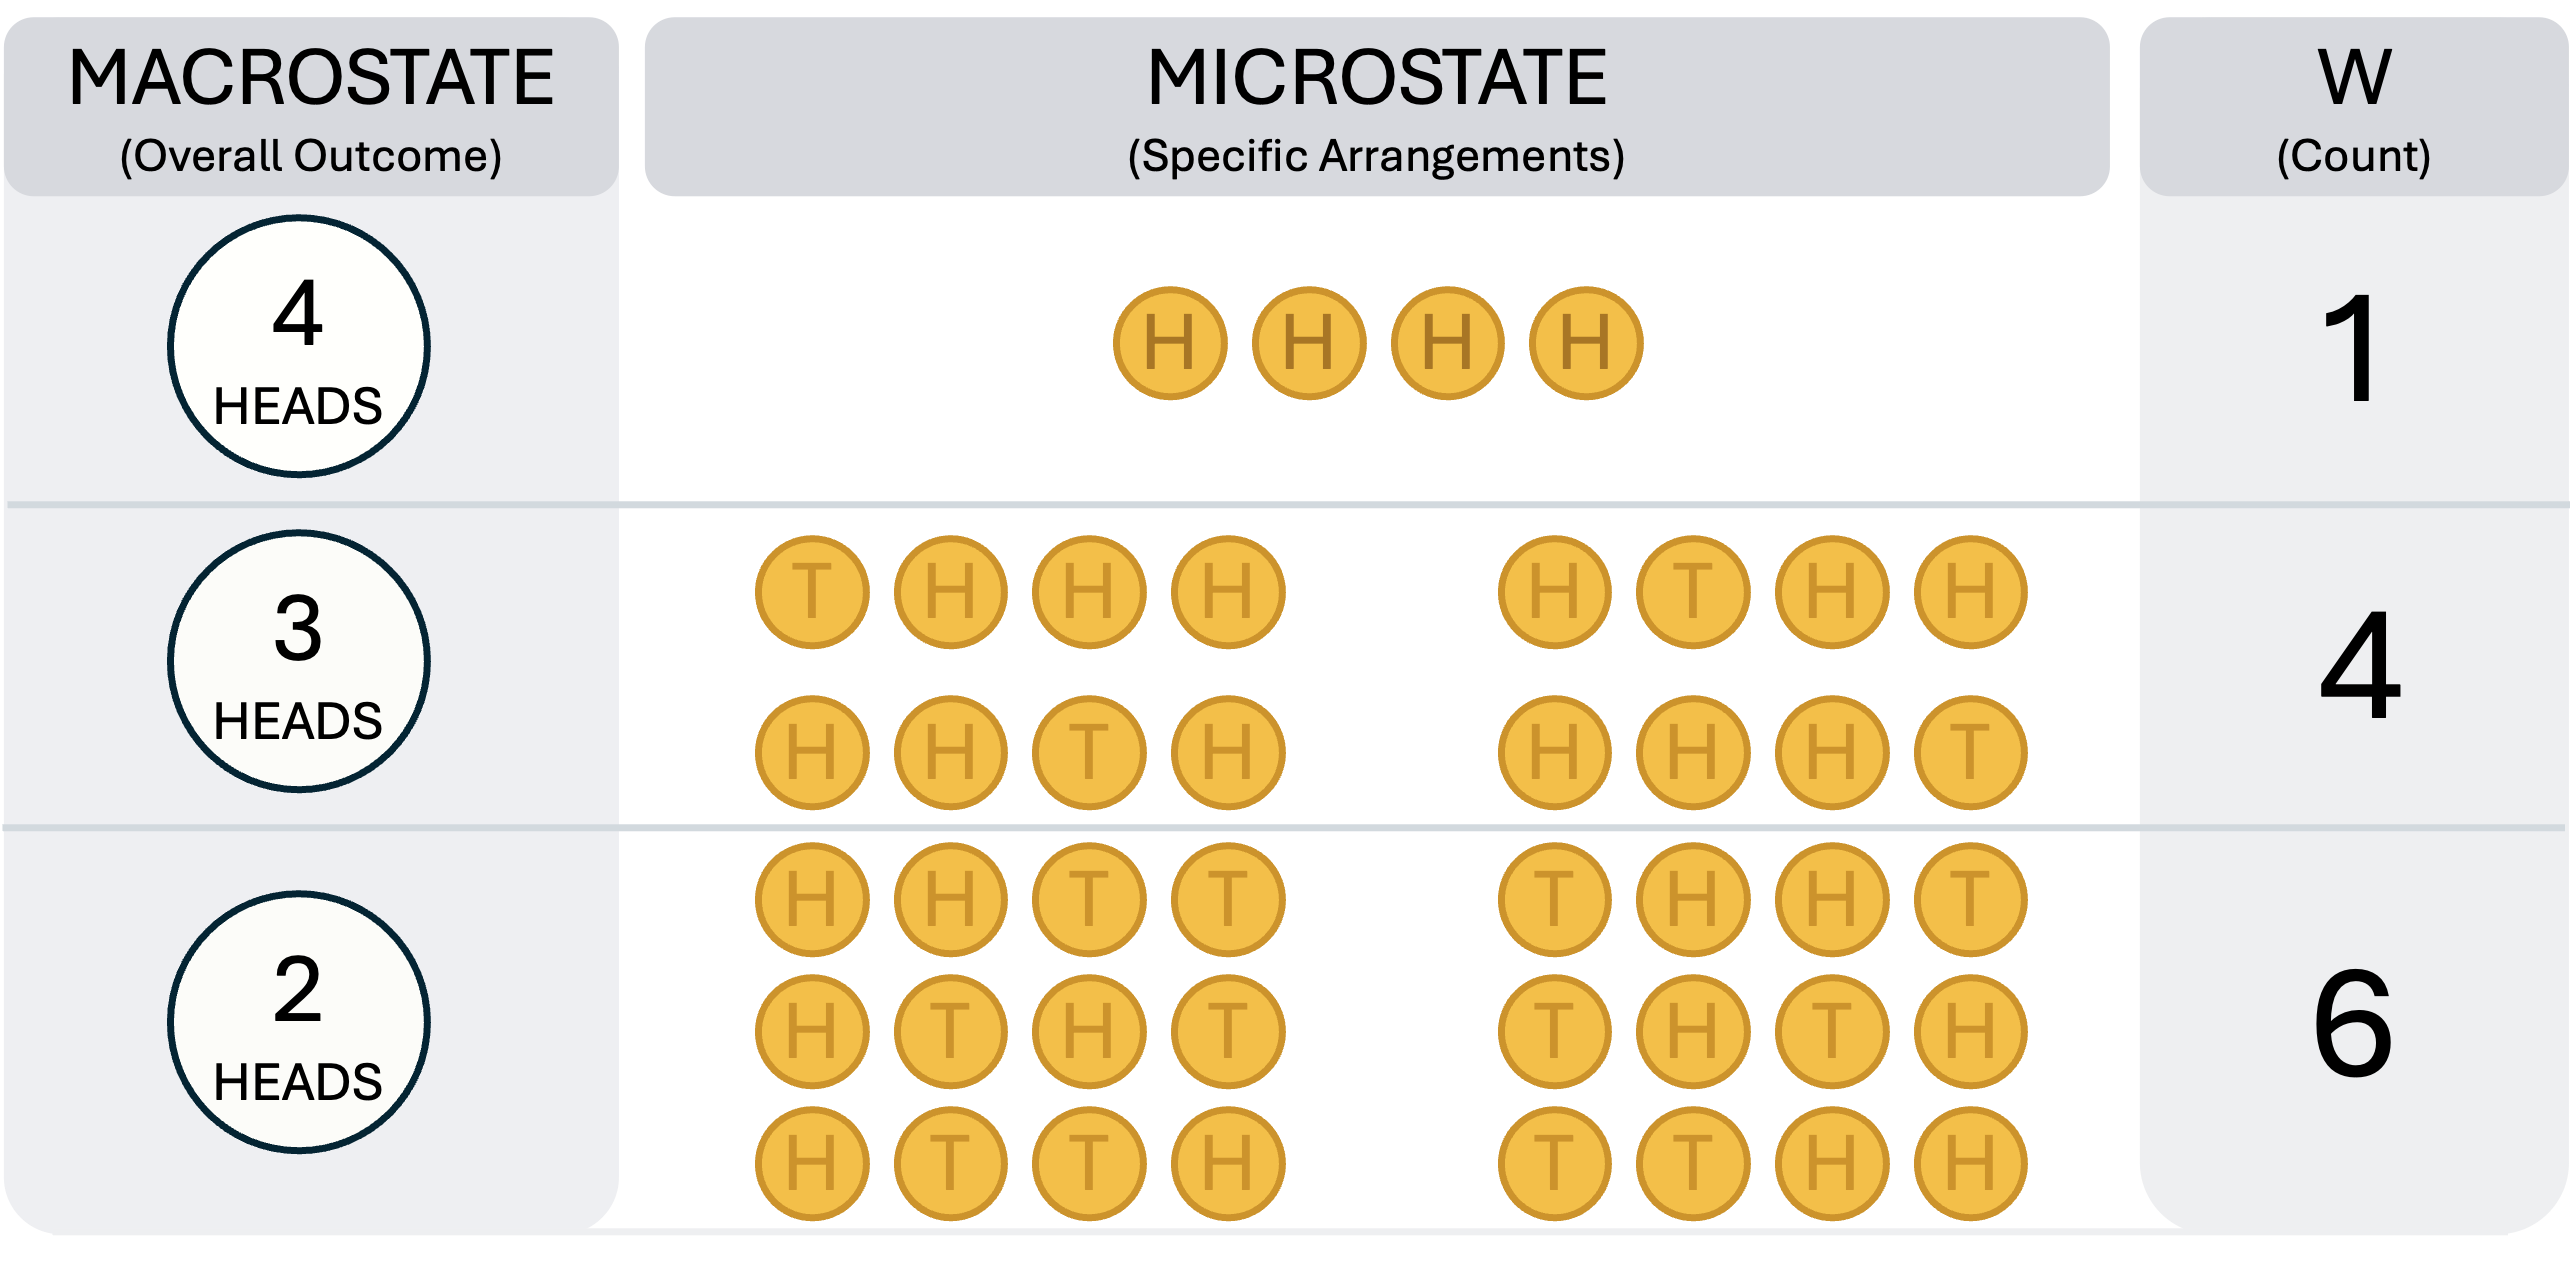
The "2 Heads" state is six times more probable than the "4 Heads" state, simply because there are six times more ways for it to happen. The universe is just like this, but with trillions of "coins" (atoms and energy packets). It doesn't "want" disorder. It simply, by the blind laws of statistics, tends to end up in the macrostate that has the most possible microstates.
The famous equation on Boltzmann's tombstone, , is just a way to count this. The (Boltzmann's constant) scales the number to our human units. The (natural logarithm) is there for a beautiful reason: it makes entropy additive. If you have two systems (A and B), the total possibilities are . The logarithm cleverly turns this multiplication into addition: . This is why "disorder" seems to work. A "messy room" has more ways to be arranged (a higher ) than a "clean room." A shattered glass has vastly more possible arrangements of its atoms than the single, specific "whole glass" state. This also explains energy dispersal. Why does a hot-iron-bar-in-water system end up as a lukewarm-bar-in-lukewarm-water? Not because of a "force." It's because there are trillions of times more ways (microstates) for the energy to be distributed among all the atoms in the bar and water than for it to be concentrated in just the bar.
The Arrow of Time
If you watch a film of two atoms colliding, it looks perfectly normal whether played forwards or in reverse. The fundamental laws of physics are reversible. But if you watch a film of blue ink mixing into a glass of clear water, you know instantly if the film is playing in reverse. Why? It's not that it's impossible for all the ink molecules, by random motion, to spontaneously gather themselves back into one tiny drop. It's just so fantastically improbable (the number of "mixed" microstates is so many trillions of times larger than the number of "un-mixed" microstates ) that it will never, ever happen in the lifetime of the universe.
This is the Second Law of Thermodynamics: The entropy of the universe (the total number of possibilities) always increases. The universe is pulled, by pure statistics, toward the state with the most possibilities. This is the second drive: All things being equal, systems are pulled toward the state with the highest possible entropy (a positive ).
Gibbs Free Energy: The Decider
We now have our two great, competing drives, where Enthalpy (): pushes for stability. It wants to be negative. On the other side, Entropy () is the pull of possibilities. It wants to be positive. What happens now when they conflict? Let's return to our ice cube which we can simply describe as: H₂O(s) → H₂O(l). To melt it, we must break the stable, low-energy crystal bonds. is positive (unfavorable). The drive for stability says, "Don't melt!". When it melts, the "ordered" crystal becomes a "disordered" liquid with far more ways to be arranged. is positive (favorable). The drive for possibilities says, "Melt!" So... does ice melt? The two drives are in a "tug of war". Who wins?
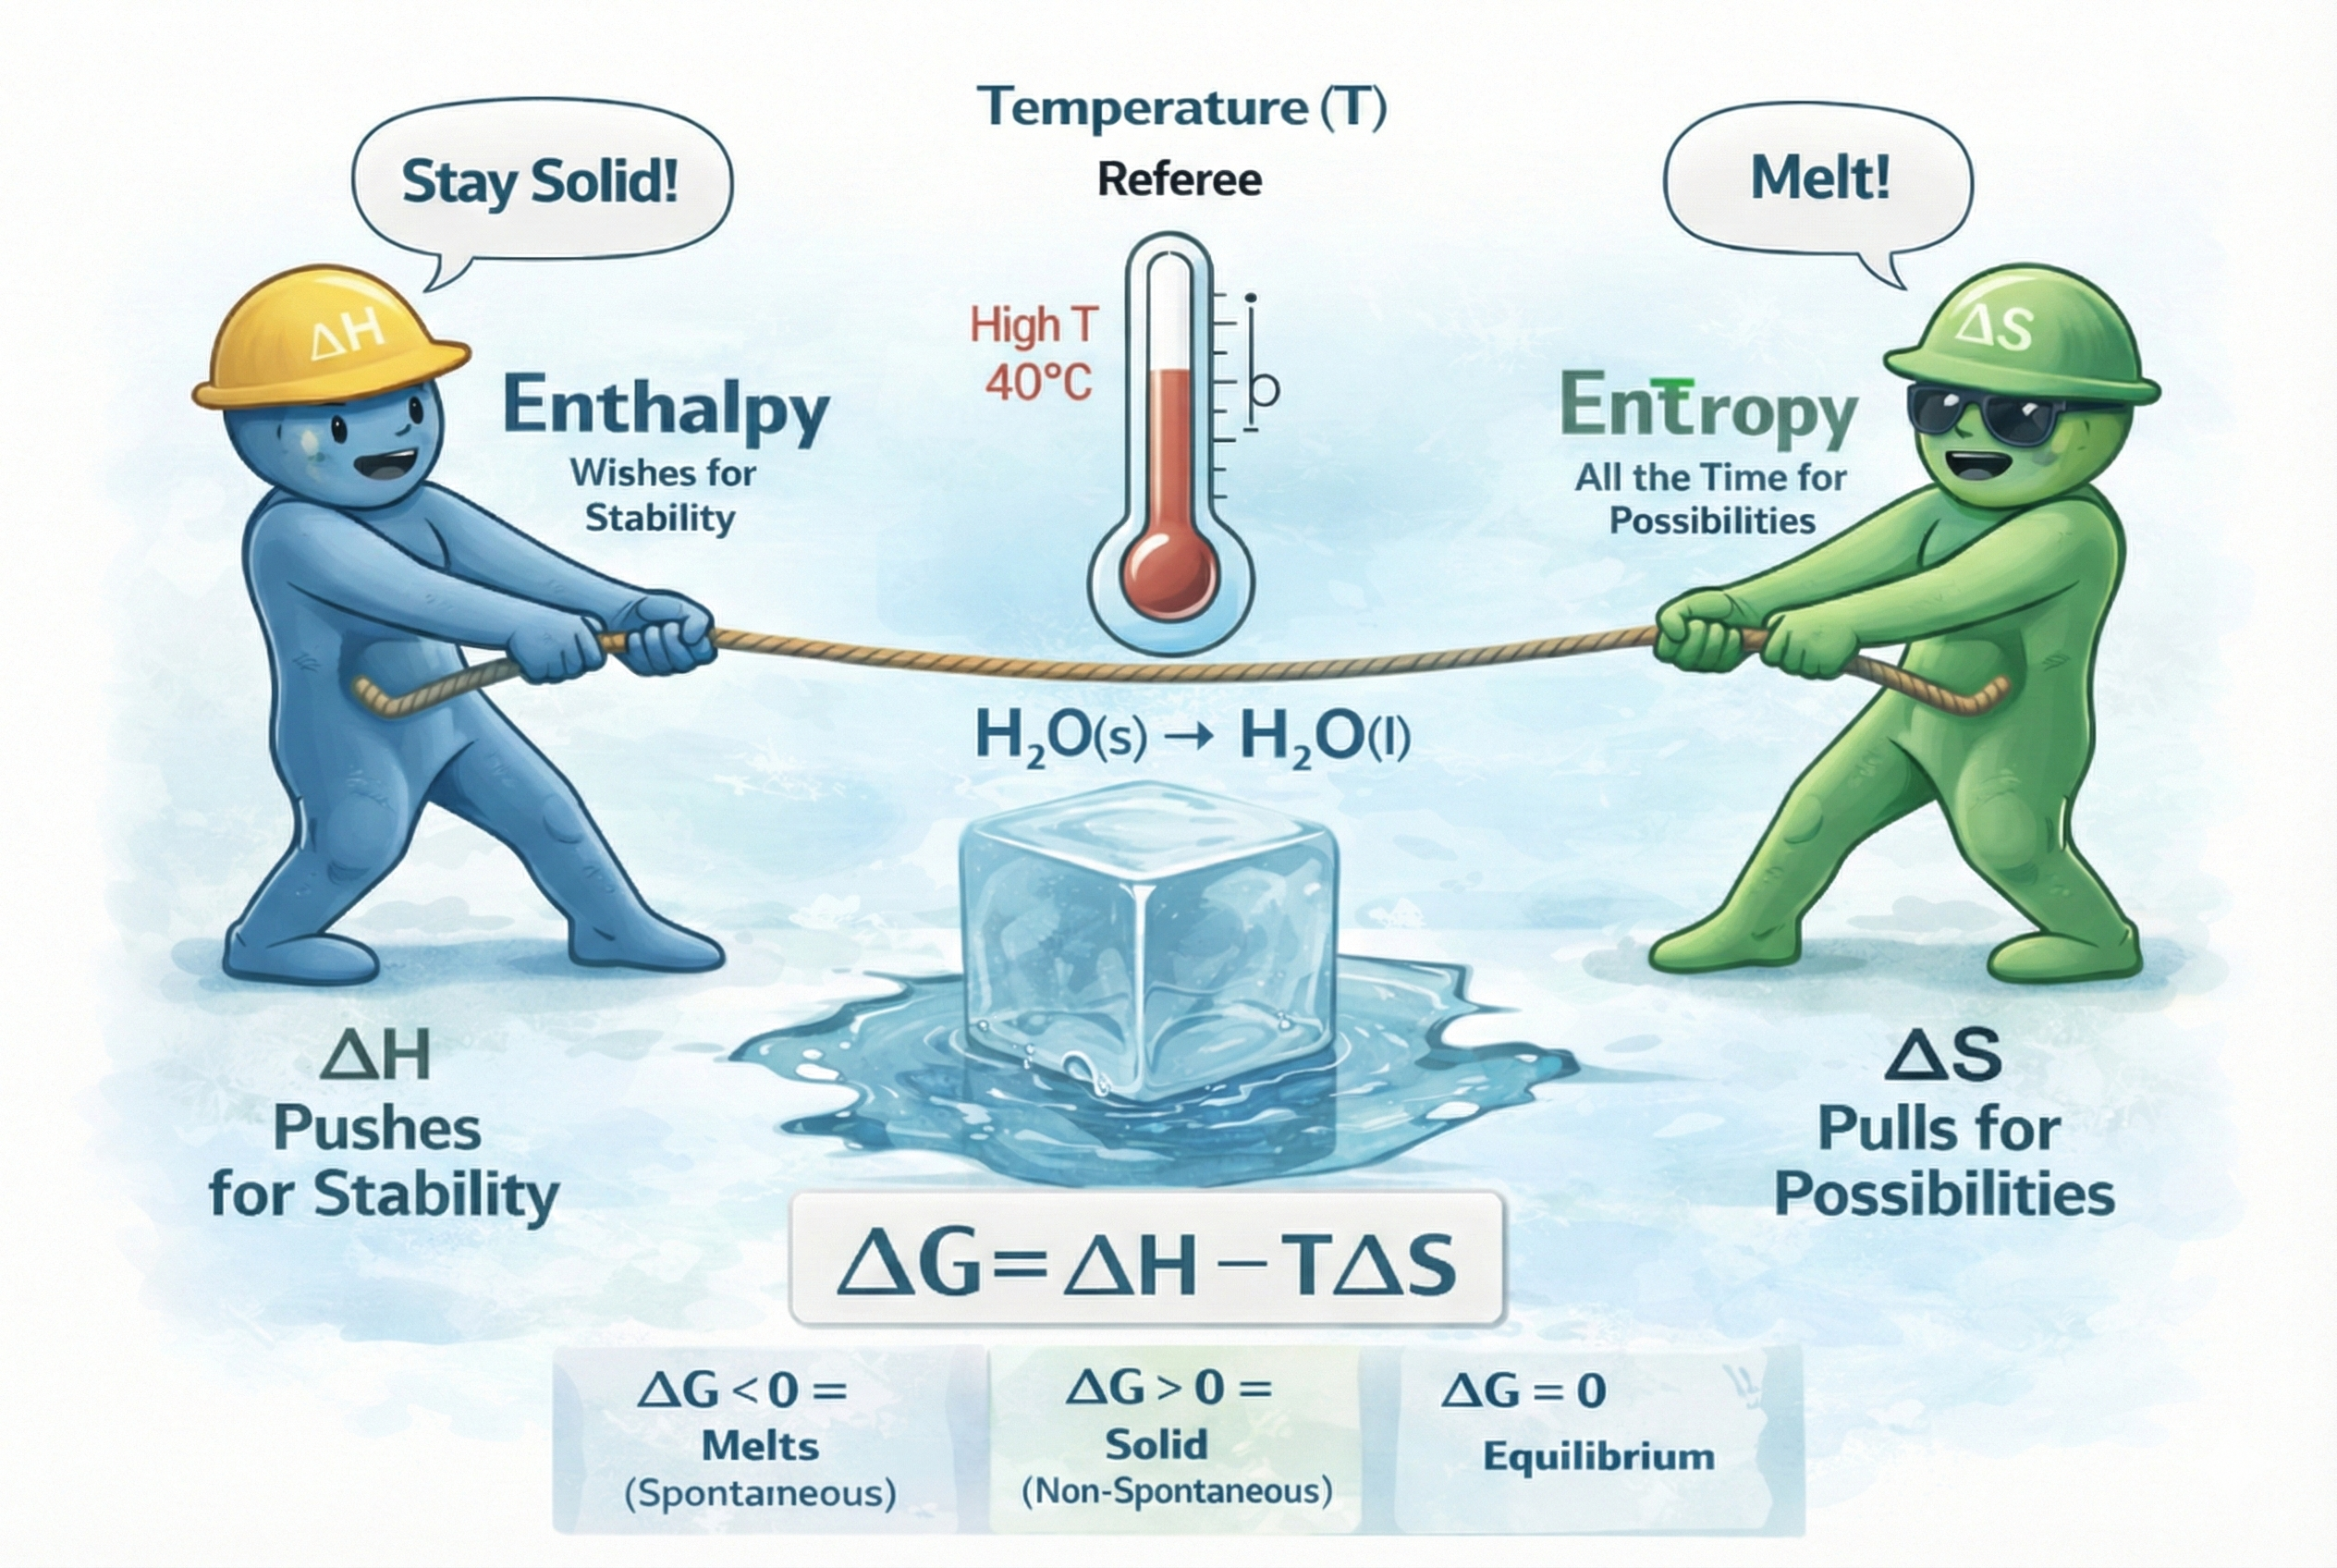
Let's use an analogy. You are at the beach on a summer day. You have two choices: You can either lie on the towel, which is a very stable, low-energy state (a favorable, negative-like ). But it's boring. There aren't many possibilities for what you can do (an unfavorable, negative-like ). So you could also go and swim and play in the water: This is an unstable, high-energy state. You have to expend energy to swim (an unfavorable, positive-like ). But it's fun. There are thousands of possibilities for new waves and new games (a favorable, positive-like ).
Which do you spontaneously choose? It depends on the temperature. If it's a cold, 15 °C day (Low ), the fun (entropy) doesn't matter. The stability (enthalpy) drive wins. You stay on the towel. If it's a hot, 40 °C day (High ), the fun (entropy) is magnified. It becomes the dominant factor. The stability drive is overwhelmed. You go in the water. Temperature () is the referee. It is the factor that scales the importance of the entropy drive.
Here is where the genius of the American physicist J. Willard Gibbs comes into play. He combined the two drives and the referee into a single equation to act as the judge and give the final verdict on spontaneity. He called it Gibbs Free Energy (). The change in Gibbs Free Energy is given by the most important equation in chemical thermodynamics: , where is the net driving force, or the "final verdict" of what will happen. The rules are simple:
If is negative, the process is spontaneous. The reaction "runs."
If is positive, the process is non-spontaneous. (The reverse reaction will be spontaneous).
If is zero, the "tug of war" is a perfect tie. The system is at equilibrium.
But what does the term physically represent? Simplified it could be described as the entropy tax. Think of it this way:
is the total energy the reaction can release.
Remember the Second Law of Thermodynamics: the total possibilities in the universe must always rise. This means, if your reaction creates order (reducing local possibilities, ), it must compensate the universe. It does this by dumping energy as heat into the surroundings, thereby increasing the motion and possibilities of the world outside the beaker.
And the term is the minimum energy tax you must pay to the universe to satisfy the Second Law.
is then what's left over. It is the (Gibbs) free energy (your take-home pay) that is actually available to do useful work (like driving the reaction forward).
Think of as your gross paycheck (how much energy you can “earn” from forming stronger bonds). The entropy requirement shows up as an entropy tax of : If the reaction makes the system more ordered ( ), this tax is positive and you must pay energy to keep the universe’s total entropy increasing; if , the tax is negative, it is a kind of subsidy. Your take‑home pay (the energy actually available to do useful work) is . If (equivalently ), you can afford the reaction and it is spontaneous. In contrast, if (), you must invest energy and it won’t run on its own.
A Practical Guide
This equation gives us a powerful predictive table that is the answer to "when a reaction runs". The following table outlines the four possible scenarios or characteristics chemical reactions can have.
ΔH (Stability) | ΔS (Possibilities) | Spontaneous? | |
|---|---|---|---|
Negative (Favorable) | Positive (Favorable) | Always Negative | Always Spontaneous (at all ) |
Positive (Unfavorable) | Negative (Unfavorable) | Always Positive | Never Spontaneous (at any ) |
Negative (Favorable) | Negative (Unfavorable) | Negative at low | Enthalpy-driven. Spontaneous only at low temperatures. |
Positive (Unfavorable) | Positive (Favorable) |
Negative at high | Entropy-driven. Spontaneous only at high temperatures. |
Our melting ice cube is in the last row: "Entropy-driven." It is non-spontaneous at low (it stays frozen) and spontaneous at high (it melts). The equation perfectly captures this.
The Landscape of Reaction
Transforming the Number to a Map
The we just calculated from tables is usually (Delta G Standard). That little symbol is a standard state label, which means all chemicals are at a standard concentration (1 M) and pressure (1 atm). This value tells us the overall spontaneity, like the total height difference between the top of a mountain (reactants) and the bottom (products). But a reaction is a journey, not a single jump. What is the actual driving force right now, when the beaker is, say, 70% full of products and 30% reactants? To see this, we need a map. We plot the system's total Gibbs Free Energy () on the y-axis versus the extent of reaction () on the x-axis. This x-axis is just a simple way of saying how much percent completion the reaction reached, from 0% (pure reactants) to 100% (pure products).
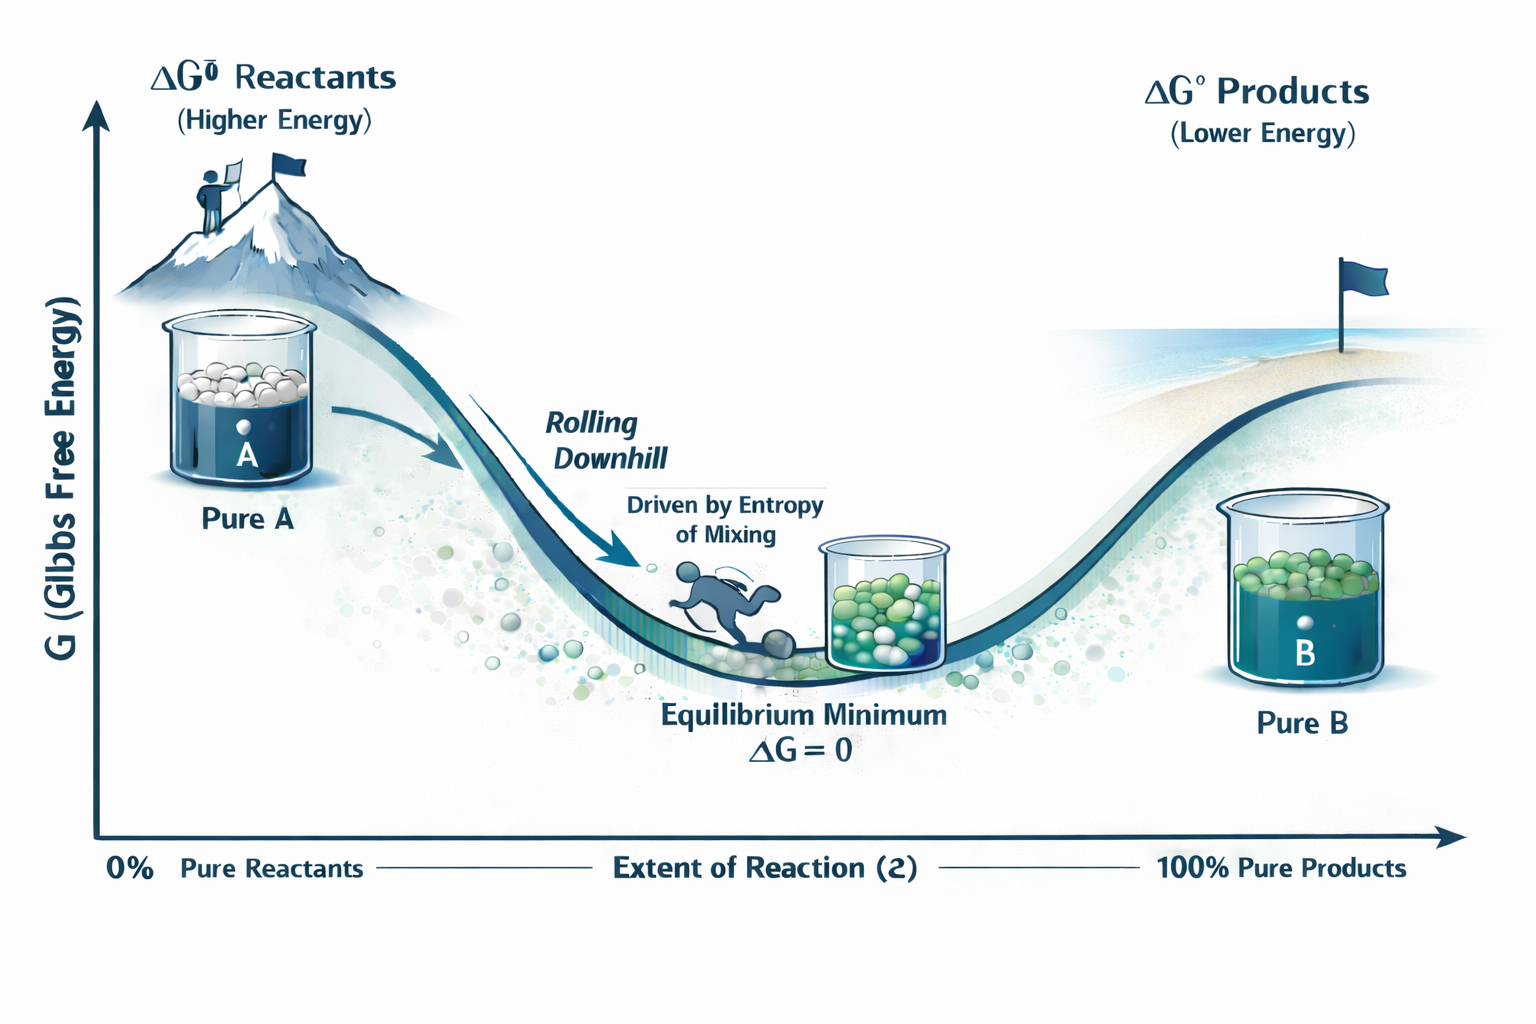
The golden rule of this map is simple: The system will always spontaneously move to a state of lower . It will always roll downhill on this graph. The lowest possible point (the bottom of the valley) is the equilibrium. But why is it a valley and why doesn't an exothermic reaction () just roll all the way to 100% products? The subtle answer is the entropy of mixing. Let's consider the following:
A beaker of pure substance A has a certain entropy.
A beaker of pure substance B has a certain entropy.
But a beaker with a mixture of A and B has more possibilities (more microstates) than the pure substances. This extra entropy of mixing means the of the mixture (since ) is lower than the of either pure side.
This "mixing" effect creates a dip in the middle of the graph. The bottom of this valley is the equilibrium point, which is why equilibrium is always a mixture of reactants and products.
The Slope of the Hill
This is the most critical concept of this section. That (standard) value is the overall height difference between the 100% and 0% marks. But the actual, real-time (non-standard) is the slope of the curve at your current position. Let's follow a reaction as it rolls down the hill:
Starting with pure reactants at the 0% mark. The hill is steep and the slope is negative. is negative. The reaction "runs" spontaneously and quickly forward.
As we rollw down, we approach the equilibrium, the hill gets flatter. The slope is less negative. is still negative, but the driving force is weaker.
At the bottom (equilibrium) of the valley, the slope is becomes zero, meaning that . The net driving force is gone. The reaction appears to stop (the forward and reverse rates are equal).
On the other side, if we started with 100% products, we'd be on the other side of the valley. The slope of the function is here positive, which means that is positive. In this case, the reaction runs again spontaneously, but in reverse direction, rolling back downhill to the equilibrium minimum.
Mathematically, this function is summarized in one elegant equation: . Here is the slope at a given position, is the overall (standard) energy change and is the reaction quotient. In other words it is the position on the function, defined as the current ratio of products to reactants. At equilibrium, two things are true: (the slope is zero) and (we call the ratio at equilibrium ). Putting this numbers into the equation gives . This rearranges to the most important equation of chemical equilibrium: . It beautifully connects the overall spontaneity of a reaction () to its final destination (the equilibrium constant, ).
Composition of the Richardson Ellingham Diagram
The Richardson-Ellingham diagram is a practical tool used by metallurgists and chemical process engineers to quickly and visually determine which reactions will run at a given temperature. To enable this assessment, the diagram plots the standard Gibbs Free Energy () against Temperature (). Let's combine our previous concepts to understand this diagram once and for all.At first glance, the chart looks complex, packed with dozens of intersecting lines. However, it is deceptively simple: it merely visualizes the linear Gibbs Free Energy equation for multiple reactions simultaneously:
It is important to note that over most temperature ranges, enthalpy () and entropy () remain relatively constant. Therefore, this equation behaves like a straight line (). In this plot, the y-intercept (at ) represents the enthalpy (), and the slope of the line represents the negative entropy (). The Richardson Ellingham diagram is typically drawn upside down, with at the top. And moving down the axis towards the bottom means a more negative . In other words, lower lines indicate more stable oxides as they oxidation reaction has a higher thermodynamic driving force.
Recall that the slope is defined as . In the graph for iron oxidation (), the line slopes upward (a positive slope). This implies that the entropy change, , must be negative (since ).Why is negative? In this reaction, a solid metal reacts with a gas to form a solid oxide. We are effectively consuming a mole of gas ()—which has enormous entropy and possibilities—and locking it into a solid crystal, which has comparatively tiny entropy. We are moving from high disorder to low disorder. Therefore, the total change in entropy () is a negative value, resulting in a positive slope on the graph. The physical implication is profound: as temperature increases (moving right), the line rises. becomes less negative, meaning the oxide becomes less stable at higher temperatures.
In many lines, you will notice kinks or sharp elbows. Why are they here? Remember, since the slope is determined by entropy, a kink indicates that has suddenly changed. This happens when there is a phase change in either a reactant or a product.For example, if the metal melts (), the entropy of the reactant increases. This shifts the overall of the reaction, causing the line to steepen slightly. If the metal boils—for example —the reactant entropy explodes, resulting in a drastic increase in the slope (see the green line at 907°C). Conversely, if the oxide boils—for example —the slope decreases (see the grey line at 1542°C). These kinks essentially mark the melting and boiling points of the species involved.
To allow for comparision of reactions, they must all be normalized. Typically, all reactions are written with one mole of gas. This is the common reactant that lets us compare them. Must it be one mole O2? No, it could also be 2 moles. Or 1/2. Or any other number. But all reacitons must have the same amount of O2. You may ask why. It is simple. Only in this manner, we can subtract one reaction from the other. Let's say we want to check if metallic solid C can reduce FeO by forming CO2. We can have the same reactions with 2 moles O2 each. You see that the position of the line changes. Also the slope changes by a factor of 2. But intersections indicating when one or the other species becomes thermodynamically stable stay at the same position (temperature). So in the end, both, and are then doubled. When we double it for all reactions, the overall diagram remains valid.
The choice to normalize every reaction to one mole of is driven by pure pragmatism: it allows us to mathematically and graphically subtract one reaction from another. Specifically, we subtract the reaction of the metal oxide we currently have from the reaction of the reducing agent we wish to use. Consider the reduction of iron oxide by carbon. We take the oxidation of carbon () and subtract the oxidation of iron (). By doing this, the oxygen terms cancel out perfectly, leaving us with the net reduction equation:
This subtraction works vertically on the graph as well. If we look at , the value for carbon is and for iron is . When we perform the subtraction (reducing agent minus metal), we get the initial starting point for our new reaction:
Because this value is positive, the reaction is non-spontaneous at this low temperature. However, the geometry of the lines saves us. Since we are subtracting the iron line (which has a positive slope) we effectively reverse it. This imparts a negative slope to our new reduction reaction line. Consequently, although the reaction starts at a positive energy value, it dives downward as temperature rises, mirroring the slope of the iron line until it eventually crosses into the spontaneous (negative) region.
How to Use the Diagram (The "Deviation" or "Competition")
This graphical subtraction leads us to the Golden Rule of the diagram: the lower line always reduces the upper line. The vertical gap between the two lines represents the specific driving force () of that reduction.For a classic example, consider the thermite reaction used to weld railway rails. The aluminum line sits far below the iron line at all temperatures. This significant gap indicates a massive negative , explaining why aluminum violently "steals" oxygen from iron oxide (), while the reverse never happens. By simply glancing at which line is lower, we can instantly predict the winner of the competition for oxygen.
The Special Case of Carbon
The final, beautiful insight of the diagram lies in the lines for carbon. Unlike metals, carbon offers a complex landscape with three interacting oxidation paths, each with a unique slope determined by entropy.First, consider the direct combustion of carbon to carbon dioxide (). Since one mole of gas is converted into one mole of gas, the entropy change is negligible, resulting in an almost horizontal line. Second, consider the oxidation of carbon monoxide gas (). Here, three moles of gas condense into two, a decrease in entropy that creates a steep positive slope. Finally, consider the formation of carbon monoxide (). In this reaction, one mole of gas expands into two, causing entropy to explode. This creates a steep negative slope, making it one of the few lines on the chart that dives downward.These three lines meet at a single crucial point around 700°C: the Boudouard equilibrium. This intersection acts as a thermodynamic switch. Below this temperature, the conversion of CO to CO₂ is the lowest line, meaning CO gas is the most effective reducing agent. This is why the cooler, upper stack of a blast furnace relies on gas-solid reduction. However, above 700°C, the downward-sloping C CO line takes over and dives below everything else. Once the temperature exceeds roughly 1000°C, this line crosses below the iron oxidation line. At this intense heat, the thermodynamics flip: solid carbon now "wants" the oxygen more than iron does, unlocking the reaction that produces the steel for our world.
Conclusion: From Microstates to Metallurgy
We have now completed the entire logical journey. It began with two fundamental, intuitive drives: the push for Stability () and the pull of Possibilities (). We saw that these forces are locked in a constant "tug of war," with Temperature () acting as the referee that determines which drive prevails. By combining them into the single "decider" equation, , we found the final verdict on spontaneity.We then mapped this drive onto a physical landscape—the vs. curve—discovering that all chemical reactions are simply systems "rolling downhill" toward the lowest energy point: equilibrium. Finally, we took that same Gibbs equation and plotted it differently ( vs. ) to reveal that it creates the simple straight lines () of the Ellingham Diagram.From the simple statistics of coin flips to the complex operation of a blast furnace, we see that everything is governed by one beautiful, precise idea. The Ellingham diagram is not a separate, complex tool; it is the inevitable, practical consequence of the same fundamental laws of and that govern all of nature.